
Most retention data tells leaders what already happened.
Turnover rates, exit interviews, engagement surveys, and tenure reports can be useful, but they usually explain the problem after retention risk has already formed.
Good retention data should do more than summarize who stayed and who left. It should help leaders see what is changing below the surface: shifting sentiment, values alignment, manager-employee fit, interpersonal alignment, team friction, smooth collaboration, and hiring or role fit.
Retention is a lagging indicator. Visibility is the missing one.
This guide explains what useful retention data should show, why traditional metrics are not enough, and how leaders can use earlier alignment visibility to prevent surprise resignations before they disrupt performance.
Table of Contents
Key Takeaways
| Point | Details |
|---|---|
| Retention data is often late | Turnover rates, engagement surveys, and exit interviews usually explain what already happened. |
| Benchmarks need context | Industry and role-level benchmarks are useful, but they do not show where hidden risk is forming. |
| Alignment data matters | Values alignment, manager-employee fit, interpersonal alignment, and team friction reveal risk earlier. |
| Surface stability can mislead | A team can look stable while commitment, connection, or collaboration is weakening below the surface. |
| Visibility changes action | Leaders need data that shows where alignment risk is forming before resignation disrupts performance. |
Why retention benchmarks are not enough
Retention benchmarks can help leaders understand whether turnover is high, low, or within a normal range.
But benchmarks are not the same as visibility.
A company may appear stable on paper while alignment risk is already forming inside a team. A leader may see low turnover and assume the organization is healthy, even though employees are quietly losing connection, collaboration is becoming harder, or values alignment is weakening.
That is why retention benchmarks should be treated as context, not as the full picture.
The more important question is not only, “How many people left?”
The better question is, “What is changing before someone leaves?”
What useful retention data should actually show
Useful retention data should help leaders see risk early enough to act.
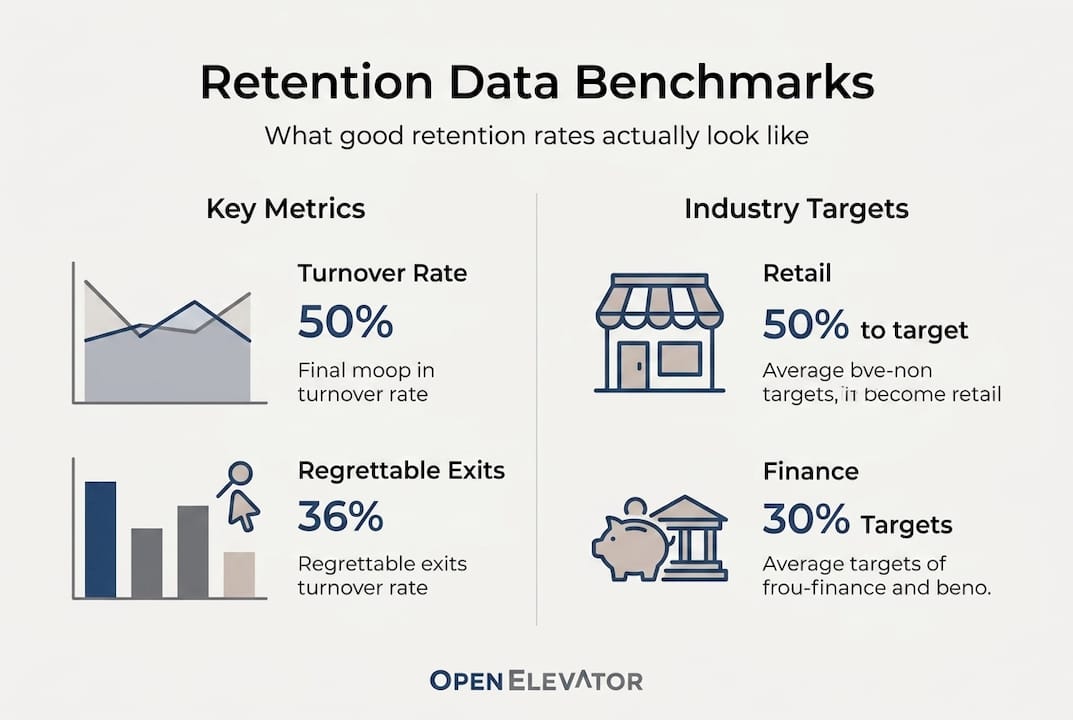
Traditional retention metrics usually include turnover rate, voluntary exits, tenure at separation, regrettable loss, and department-level patterns. These numbers are useful, but they are mostly backward-looking.
They tell leaders what happened.
What leaders also need is visibility into what is happening now.
Useful retention data should show:
-
Where sentiment may be shifting
-
Where values alignment may be weakening
-
Where manager-employee fit may be strained
-
Where interpersonal alignment may be creating friction
-
Where smooth collaboration is breaking down
-
Where hiring or role fit may not match the real working environment
-
Where team-level alignment risk may be forming before turnover appears
The goal is not more reporting.
The goal is better signal quality, so leaders can act before disengagement becomes resignation.

Where retention data can mislead leaders
Retention data can mislead leaders when it is treated as the whole answer.
A low turnover rate does not always mean a team is healthy. It may mean employees are staying while disengaged, misaligned, or disconnected.
A high turnover rate does not always mean the same problem everywhere. The root issue may sit inside one team, one role type, one working relationship, or one values mismatch.
A stable team does not always mean a committed team. Employees may continue doing the work while their connection to the role, manager, team, or organization is already changing.
That is why retention data needs alignment context.
Leaders need to understand not just who stayed or left, but where fit, connection, collaboration, and values alignment may already be shifting below the surface.
How leaders can turn retention data into earlier action
The value of retention data is not in the dashboard. It is in the decision it improves.
Leaders can use retention data more effectively by asking better questions:
-
Where is alignment risk forming before turnover appears?
-
Which teams look stable but may be losing connection?
-
Where is manager-employee fit creating quiet friction?
-
Where are values alignment or interpersonal alignment weakening?
-
Where are collaboration patterns becoming harder?
-
Which new hires may not fit the real working environment?
-
What action should leaders take before disengagement disrupts performance?
This moves retention from hindsight to foresight.
Instead of waiting for exit interviews, turnover reports, or engagement surveys to confirm the problem, leaders can act while there is still time to protect performance.
Why retention rates alone can backfire
A strong retention rate can look reassuring.
But if leaders only measure who stayed, they may miss whether the right people are still engaged, aligned, and able to collaborate smoothly.
Some employees stay while disconnected. Some teams look stable while trust or alignment is weakening. Some high performers keep delivering while quietly deciding whether the organization still fits what they value.
That is why retention rate alone is not enough.
The stronger measure is whether leaders can see alignment risk before it turns into resignation, performance disruption, or preventable turnover.
Retention is a lagging indicator.
Visibility is the missing one.
How OpenElevator helps leaders see retention risk earlier
Good retention data should help leaders see what is changing before someone leaves.
OpenElevator quantifies alignment risk early so leaders can see what is happening below the surface: shifting sentiment, hidden disengagement, values alignment, manager-employee fit, interpersonal alignment, team friction, smooth collaboration, and hiring or role fit.
Engagement surveys, turnover data, and exit interviews are lagging indicators. OpenElevator gives leaders earlier visibility into where misalignment is creating friction and what action to take before disengagement disrupts performance.
Get your free OpenElevator team scan to experience the platform, gain real retention-risk visibility, and see what may be hidden below the surface — with zero cost and zero risk.
Frequently asked questions
What does good retention data show?
Good retention data should show more than who stayed and who left. It should help leaders see where sentiment, values alignment, manager-employee fit, interpersonal alignment, team friction, and hiring or role fit may be creating retention risk.
Why are turnover rates not enough?
Turnover rates are lagging indicators. They show what happened after someone already left. Leaders need earlier visibility into what is changing below the surface before resignation disrupts performance.
Are engagement surveys useful retention data?
Engagement surveys can be useful, but they are still lagging indicators. They show how employees felt at a point in time and may miss whether alignment risk is already forming.
What retention data helps prevent surprise resignations?
Data that reveals alignment risk helps leaders act earlier. This includes values alignment, manager-employee fit, interpersonal alignment, team friction, smooth collaboration, shifting sentiment, and hiring or role fit.
How does OpenElevator improve retention visibility?
OpenElevator quantifies alignment risk early so leaders can see where misalignment is creating friction before disengagement becomes resignation. The free team scan lets leaders experience the platform with zero cost and zero risk.