
TL;DR:
- Reliable retention data highlights organizational health, with aim for 80-90% annual retention.
- Tracking role-specific, manager-related, and voluntary versus involuntary turnover reveals actionable insights.
- Continuous monitoring and targeted interventions prevent costly high turnover and workforce stagnation.
Most leaders I speak with believe their retention is fine. Until it isn’t. The moment a high-performer walks out, or a whole team quietly disengages, the cracks that were always there suddenly become visible. Here’s the uncomfortable truth: voluntary turnover below 10-15% annually is the target most industries should be chasing, yet a surprising number of organizations don’t even know where they stand. If you’re leading a medium or large SME and you’re relying on gut feel or annual engagement surveys to gauge retention health, this guide is for you. We’re going to look at what good retention data actually is, how to read it honestly, and what to do with it.
Table of Contents
- Why clear retention benchmarks matter
- Core components of actionable retention data
- Making sense of industry differences and edge cases
- Transforming retention data into action
- A fresh perspective: Why obsessing over retention rates alone can backfire
- Take the next step: Elevate your retention strategy
- Frequently asked questions
Key Takeaways
| Point | Details |
|---|---|
| Benchmarks vary by industry | What counts as good retention depends heavily on your sector and organizational level. |
| Data segmentation drives insight | Actionable data separates voluntary from involuntary turnover and segments by role. |
| Employee experience matters most | Cultural factors like teamwork and recognition influence retention more than pay alone. |
| Application trumps analysis | Acting on retention data with targeted strategies produces real organizational improvements. |
Why clear retention benchmarks matter
Let me paint a picture. A CEO I know was proud of her company’s stability. Headcount barely moved for two years. She took that as a sign of a healthy culture. Then, in a single quarter, three of her top managers left within weeks of each other. The exits felt sudden. They weren’t. The warning signs had been building quietly for over a year, but without clear benchmarks, there was nothing to measure against, nothing to trigger an earlier conversation.
This is the trap most leaders fall into. They confuse stillness with satisfaction.
So what does good actually look like? For US medium and large SMEs, the data is fairly clear. Aim for 80-90% retention annually, which translates to a 10-20% turnover rate. The Bureau of Labor Statistics JOLTS data puts the monthly quits rate at roughly 2.0%, while Mercer’s research places voluntary turnover at around 13% per year. These aren’t arbitrary numbers. They reflect the natural rhythm of a healthy workforce, where some movement is expected and even healthy, but not so much that it destabilizes teams or drains organizational knowledge.
Why does this matter so much for business performance? Consider the costs. Replacing a mid-level employee typically runs anywhere from 50% to 200% of their annual salary when you factor in recruiting, onboarding, lost productivity, and the institutional knowledge that walks out the door with them. Multiply that across a team of 200 people with a 20% annual turnover rate, and you’re looking at a significant drag on growth before you’ve even opened a spreadsheet.
Beyond cost, there’s culture. High turnover signals instability to the people who stay. It erodes trust, strains managers, and quietly tells your best performers that maybe they should be looking too.
“Retention isn’t just an HR metric. It’s a leading indicator of organizational health, and most leaders are reading it too late.”
Here’s what makes benchmarking genuinely useful: breaking it down by role level. Executive and senior leadership turnover should sit well below 10%. Management-level turnover in the 6-10% range is generally acceptable. Frontline and entry-level roles naturally see higher movement, often 20-30% depending on industry, and that’s not automatically a red flag. The key is knowing what’s normal for each layer of your organization, and tracking against it consistently. Exploring employee retention solutions that give you this kind of layered visibility is where most organizations start to see real change.
Core components of actionable retention data
Once you know what you’re benchmarking against, the next question is: what data should you actually be collecting? This is where a lot of organizations go wrong. They track overall headcount changes and call it retention data. That’s like checking the weather by looking out the window once a year.
Actionable retention data has several essential layers:
- Overall turnover rate — the baseline. Total separations divided by average headcount, expressed as a percentage.
- Voluntary vs. involuntary separation — this distinction matters enormously. Voluntary turnover (employees choosing to leave) tells you about engagement, culture, and opportunity. Involuntary (terminations, layoffs) tells a different story entirely.
- Tenure at separation — are people leaving in their first year? After three years? The timing reveals where the experience is breaking down.
- Role-based analysis — segmenting by department, level, and function helps you stop treating your workforce as a monolith.
- Manager-level data — turnover clustered under specific managers is one of the clearest signals you’ll ever get.
The voluntary turnover average sits at 13% according to Mercer’s 2024-25 research, with under 15% as a reasonable target and under 10% as genuinely healthy. But a single data point in time tells you almost nothing. What matters is the trend. Is your voluntary turnover creeping up quarter over quarter? That’s the signal. A one-time spike might reflect an industry-wide shift or a single bad manager situation. A sustained upward trend is a systemic problem.
Here’s a simple framework for thinking about your data quality:
| Metric | What it tells you | Risk if ignored |
|---|---|---|
| Voluntary turnover rate | Engagement and culture health | Miss early disengagement signals |
| Tenure at exit | Where the experience breaks down | Lose onboarding and development ROI |
| Manager-level turnover | Leadership effectiveness | Team instability spreads silently |
| Regrettable vs. non-regrettable exits | Quality of retention | Retain wrong people, lose the right ones |
One distinction that often gets overlooked: the difference between regrettable and non-regrettable turnover. Not every exit is a loss. Sometimes people leave who weren’t a great fit, and that’s healthy movement. The danger is when you’re losing your high-performers and retaining your disengaged employees. That’s a retention number that looks fine on paper but is quietly hollowing out your organization.
Pro Tip: Start tracking “regrettable exits” as a separate metric. Ask managers to flag departures where the loss meaningfully impacts team performance. Over time, this gives you a far more honest picture than overall turnover alone.
For organizations serious about lowering turnover rates, the shift from point-in-time snapshots to continuous trend monitoring is often the single biggest improvement they can make.

Making sense of industry differences and edge cases
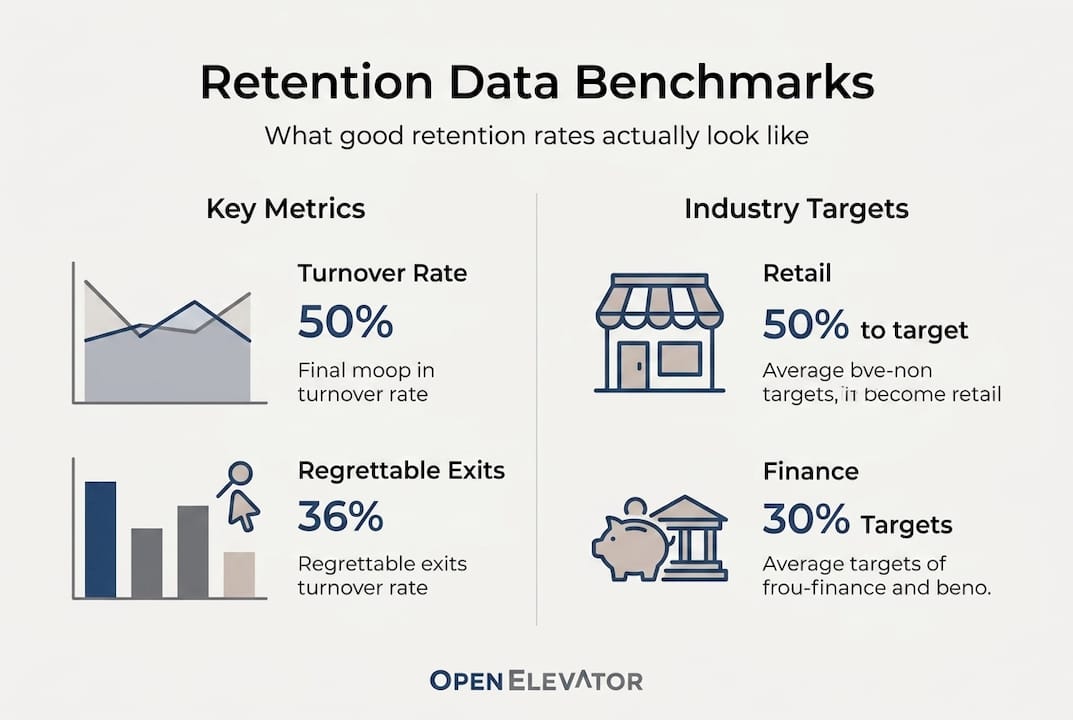
Here’s where a lot of well-meaning benchmarking goes sideways. A 15% annual turnover rate at a retail chain is a genuine success story. The same rate at a boutique financial advisory firm is a crisis. Context isn’t just helpful here. It’s everything.
The industry spread is dramatic: retail sees voluntary turnover as high as 26.7%, while finance sits at around 8.2%. Professional services, healthcare, and technology each have their own norms, shaped by labor market dynamics, compensation structures, career progression patterns, and the nature of the work itself.
Here’s a quick comparison to ground your thinking:
| Industry | Typical voluntary turnover | Healthy target |
|---|---|---|
| Retail | ~26.7% | Under 22% |
| Hospitality | ~28-30% | Under 25% |
| Finance | ~8.2% | Under 8% |
| Professional services | ~12-15% | Under 12% |
| Technology | ~13-18% | Under 13% |
Role level adds another dimension. Executive turnover averages around 5.2%, management around 6.3%, while frontline roles trend significantly higher. On a small team, losing one senior leader carries the weight of losing five frontline employees in terms of institutional knowledge and strategic continuity. That’s why raw turnover percentages can be misleading without role-level context.
A few things worth watching in today’s labor market:
- Passive job searching is widespread. Research suggests roughly 51% of US workers are open to new opportunities at any given time, even those who appear engaged and stable.
- Competitor benchmarking is useful but imperfect. Industry averages tell you what’s normal, not what’s possible. The best organizations set internal targets that beat their sector average.
- Economic cycles shift the numbers. In tighter labor markets, voluntary turnover often drops because people feel less confident about finding alternatives. Don’t mistake a quiet labor market for a healthy culture.
The practical takeaway: always contextualize your retention data against your industry, your role mix, and the broader economic environment before drawing conclusions. A number without context is just noise.
Transforming retention data into action
Diagnosis without action is just an expensive exercise in self-awareness. The organizations that actually improve retention are the ones that build a clear line from data to decision.
Here’s a framework that works:
- Identify where turnover is concentrated. Is it a specific department, manager, tenure band, or role level? Patterns in the data almost always point to a root cause.
- Separate symptoms from causes. High turnover in a team might look like a pay problem but actually reflect a management issue or a lack of career development. Exit interviews, stay interviews, and pulse surveys help here.
- Link findings to specific interventions. Culture issues need different solutions than compensation gaps or workload problems. Precision matters.
- Communicate findings across leadership. Retention is not an HR problem. It’s a leadership problem. Sharing data transparently with your executive team creates shared accountability.
- Set a 90-day action horizon. Long-term strategies matter, but quick wins build momentum and signal to employees that leadership is paying attention.
The 2025 SHRM State of the Workplace report found that employee experience factors, specifically teamwork, a sense of purpose, fairness, and recognition, are central to retention, with 34% of workers reporting a lack of these elements. Notably, 2025 also marked a shift in HR priorities from pure recruiting toward employee development, which reflects a broader recognition that retention starts long before someone decides to leave.
Pro Tip: Don’t wait for exit interviews to learn why people leave. “Stay interviews” with current employees, asking what keeps them here and what might push them out, give you actionable intelligence while you still have time to act on it.
For organizations focused on measuring retention health with real precision, the shift from reactive to proactive is where the real competitive advantage lives.
A fresh perspective: Why obsessing over retention rates alone can backfire
I’ll be honest with you. After spending years looking at retention data across organizations of all sizes, the most dangerous number I’ve seen isn’t a high turnover rate. It’s a suspiciously low one.
High retention can mask a workforce that has simply stopped trying. People who have mentally checked out but haven’t physically left yet. Employees who dread Mondays but stay because the alternative feels uncertain. That’s not loyalty. That’s inertia. And it’s corrosive in ways that don’t show up in your turnover spreadsheet.
The best leaders I’ve worked with don’t just ask “how many people are staying?” They ask “who is staying, and why?” They pair retention rates with quality-of-hire data, engagement scores, and honest conversations about whether the people in key roles are still growing and contributing at the level the organization needs.
Strategic turnover, the kind where someone moves on because they’ve outgrown the role or because the fit was never quite right, is healthy. It creates space for new thinking, new energy, and better alignment. Chasing zero turnover is not the goal. Chasing the right retention, where your best people stay engaged and your organization keeps evolving, is.
Oversimplifying the numbers is how organizations end up with teams that look stable on paper but feel stagnant in practice. The data should always be a starting point for a conversation, not the end of one.
Take the next step: Elevate your retention strategy
Understanding what good retention data looks like is one thing. Building the systems to capture it, interpret it, and act on it consistently is where most organizations get stuck.
OpenElevator was built specifically for this gap. It gives C-level executives and HR leaders the visibility layer that traditional HR systems simply don’t provide: early warning signals, clear retention risk indicators, and insight into how well new hires are likely to fit within your existing teams. If you’re ready to move from instinct to informed decisions, explore OpenElevator retention solutions and see what your retention data has been trying to tell you.
Frequently asked questions
What is considered a good employee retention rate for US SMEs?
A good retention rate for US medium-large SMEs is 80-90% annually, meaning a 10-20% annual turnover rate falls within the typical healthy range.
How do voluntary and involuntary turnover rates differ?
Voluntary turnover is when employees choose to leave, with a 13% annual average per Mercer’s research, while involuntary turnover covers terminations and layoffs driven by the organization.
Why does industry matter when comparing retention data?
Different industries operate under very different norms, with retail at 26.7% voluntary turnover compared to finance at just 8.2%, making cross-industry comparisons misleading without context.
What factors most affect retention beyond pay?
According to SHRM, teamwork, purpose, and recognition consistently drive retention more than compensation alone, with 34% of workers citing a lack of these factors.
How often should retention data be reviewed?
Most organizations benefit from quarterly retention reviews to catch emerging trends early enough to respond before disengagement becomes departure.